B2B Cold Email: What Benchmarks Should You Aim For in 2026?
3% or 10% reply rate? Cold email benchmarks change with what each source measures. Here are the published numbers, their sources, and how to make sense of them.
Why Cold Email Benchmarks Vary So Much by Source
Search "cold email reply rate" and you'll find numbers that differ tenfold. The sources don't measure the same thing: one divides replies by every email sent, follow-ups included, another by the people contacted, a third only talks about its best customers. No vendor publishes figures specific to France. The ones below come from the reports of Instantly, Hunter, Belkins and Gong on their recent sends, and each links the page we read it on.
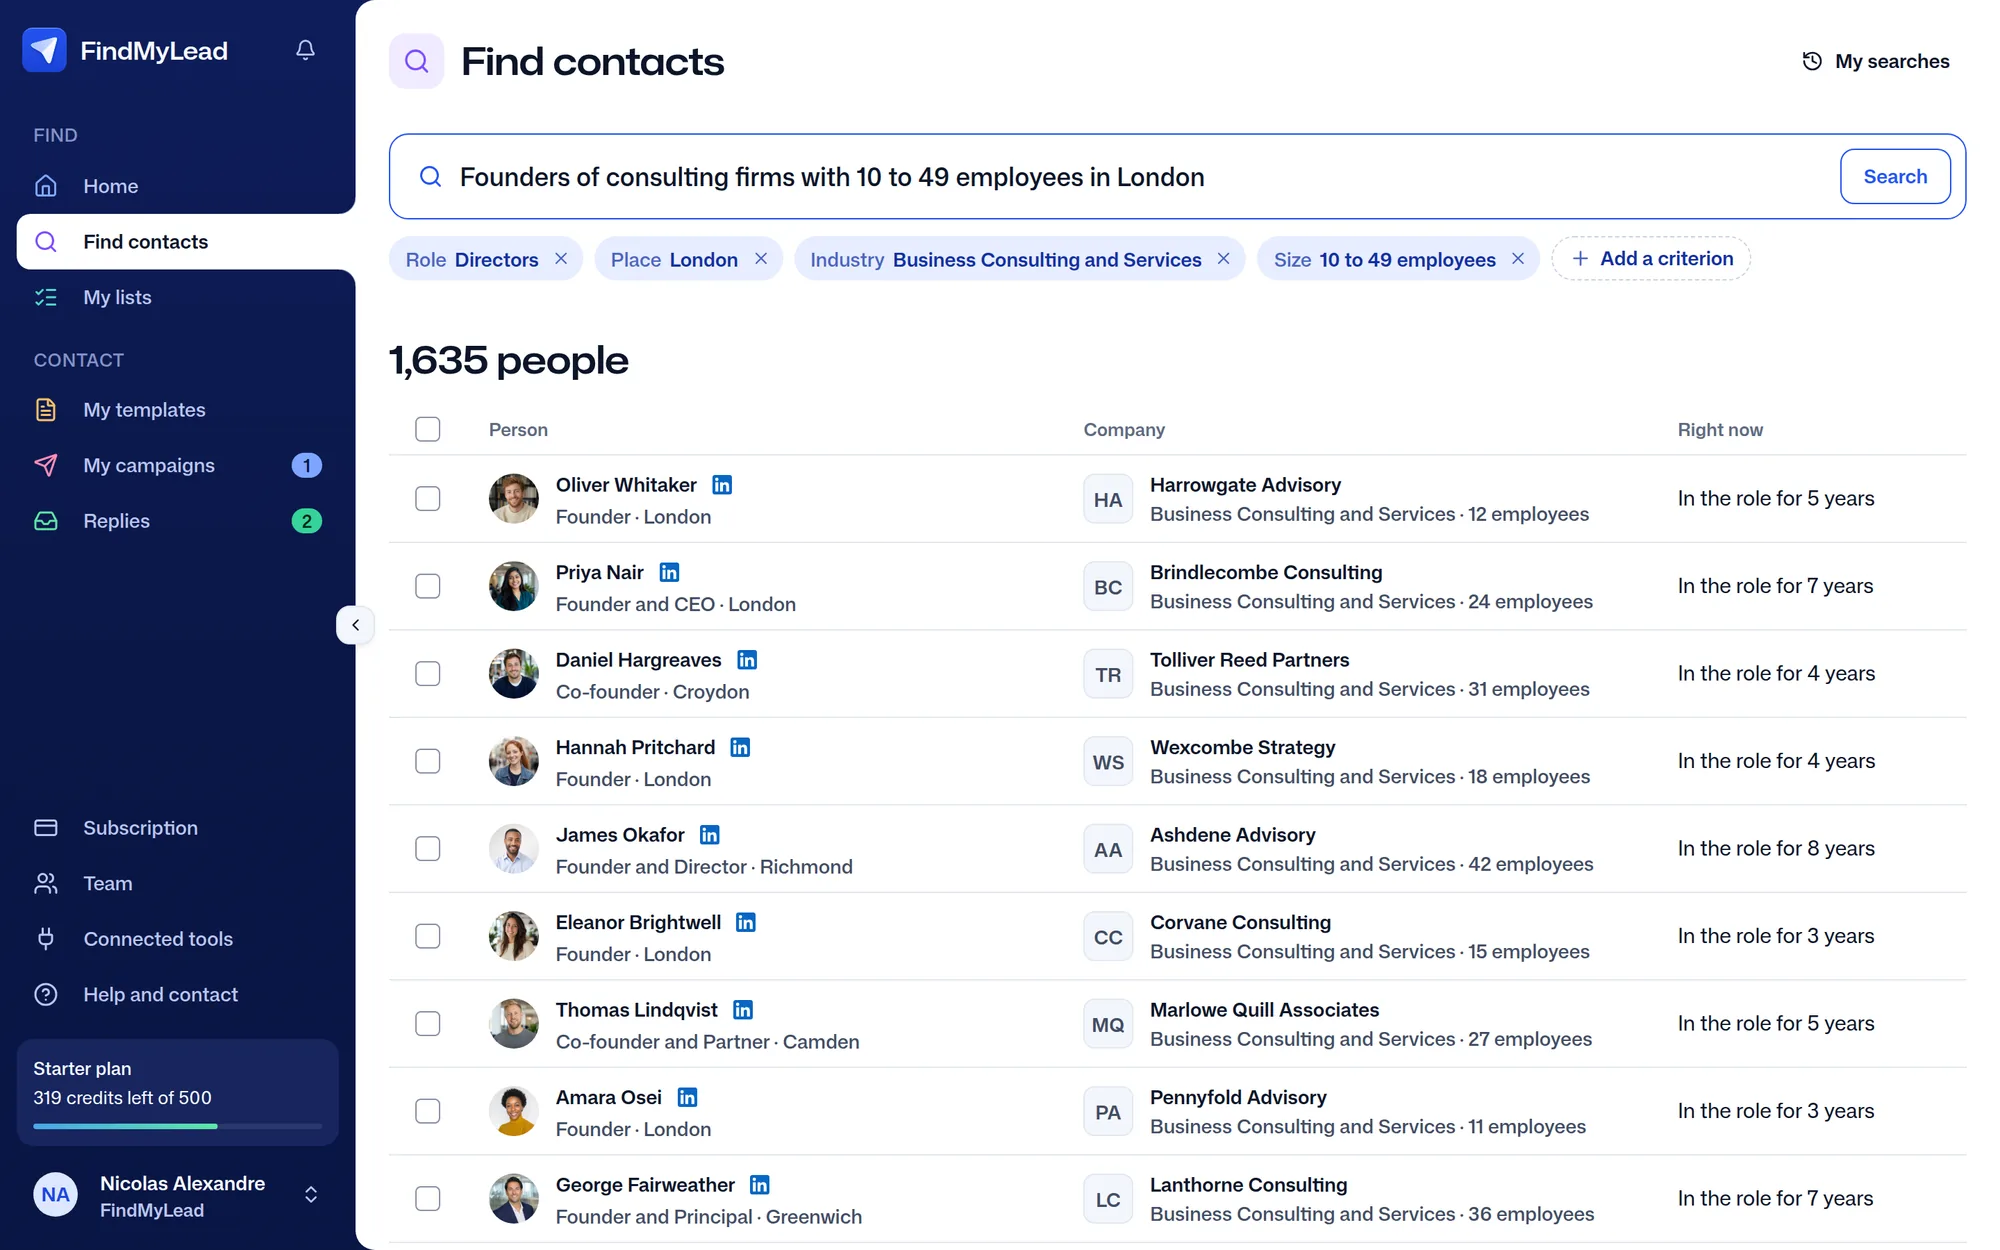
Their LinkedIn and their email, in one sentence.
Marketing directors in Nantes, companies of 20 to 200 employees
Free
Open Rate: A Metric to Handle with Caution
Hunter measures an average open rate of 30% across 31 million emails sent by its users in 2025 (Hunter's report).
That number overstates reading. Since 2021, Apple's Mail Privacy Protection downloads a message's remote content in the background when it is received, not when it is viewed (Apple's Mail guide). The tracking pixel loads without anyone opening the email: the more Apple users on your list, the more inflated your open rate.
Practical takeaway: treat open rate as a warning signal (are my subject line and deliverability roughly working?), not as the metric that steers your campaigns.
Reply Rate: The Metric That Actually Matters
Unlike an open, a reply can't be triggered by an automatic download: it's a deliberate action from the recipient. That's why it should be your primary indicator.
What vendors publish on their 2025 sends:
- Instantly, across its whole platform: a 3.43% average reply rate, 5.5% for the top quartile of campaigns, over 10.7% for the top 10% (Instantly's 2026 report).
- Hunter, across 31 million emails: 4.5% per sequence, 45 replies for every 1,000 people contacted (Hunter's report).
- Belkins, across 7.5 million emails sent for its clients: 0.45%, but divided by every email sent, follow-ups included, not by person contacted (Belkins' study).
Leaving out Belkins, which counts every follow-up, the published average therefore sits between 3 and 5%, and above 5.5% a campaign is in the top quartile (Instantly's 2026 report). If you stay well below after a few hundred contacts, look at targeting and messaging first, before the sending tool.
Where Do Replies Actually Come From?
A large share of replies comes from follow-ups, but the sources disagree on how large: 42% at Instantly, where the first email brings the remaining 58% (Instantly's 2026 report), 58.6% at Belkins across 7.5 million emails (Belkins' follow-up study). At Hunter, three messages instead of one double the replies, from 3.3% to 6.8% (Hunter's report). A campaign with no follow-up leaves 40 to 60% of its replies on the table.
A short sequence is enough: 3 emails spaced 3 to 5 days apart, with a final message that shifts tone, less sales-y and more direct ("I don't want to be pushy, just let me know if this isn't the right time").
The Factors That Actually Make a Difference
Send day
At Instantly, replies peak on Tuesday and Wednesday, Wednesday highest (Instantly's 2026 report).
Email length
Gong, across more than 28 million cold emails, puts the ideal length at 100 words or fewer (Gong's study). Instantly's best-performing campaigns stay under 80 words (Instantly's 2026 report). An email that needs scrolling on a phone is already too long.
Minimal personalization
First name and company name alone no longer stand out, but remain the baseline. At Hunter, two custom fields raise the reply rate from 3.6% to 5.6% (Hunter's report). An opening line tied to real company news (hiring, funding, industry news) goes further than a generic message.
Database quality
Instantly advises keeping the bounce rate below 2%, ideally much lower (Instantly's 2026 report); at Hunter, the observed average is 3.6% (Hunter's report). Every bounce damages your sender reputation, and so all your following campaigns, not just the current one. An up-to-date database from a reliable source remains the most underestimated lever in email prospecting.
Quick Reference
Metric |
Published average |
Best campaigns |
Source |
|---|---|---|---|
Open rate |
30%, inflated by Apple |
not published |
|
Reply rate |
3.43% |
5.5% (top quartile), 10.7% (top 10%) |
|
Reply rate per sequence |
4.5% |
not published |
|
Share of replies from follow-ups |
42% |
not published |
|
Share of replies from follow-ups |
58.6% |
not published |
|
Bounce rate |
3.6% observed |
under 2% advised |
The Bottom Line
Don't chase a single number found in an article: check what each source divides by what, and focus your energy on reply rate rather than open rate. A reliable database, a short and personalized message, and a well-spaced 3-email sequence remain the three levers that separate an average campaign from a good one. To measure these numbers on your own sends, FindMyLead’s pricing starts with a free trial.